
Supply chain resilience, and what it costs to have
Every guide on this topic lists the same four pillars and prices none of them. This one puts a cost against each move, names the mechanism that turns a small shock into a large one, and reports what the Federal Reserve is currently measuring.
- Reviewed 18 August 2026
- The Insight Journal Editorial Team
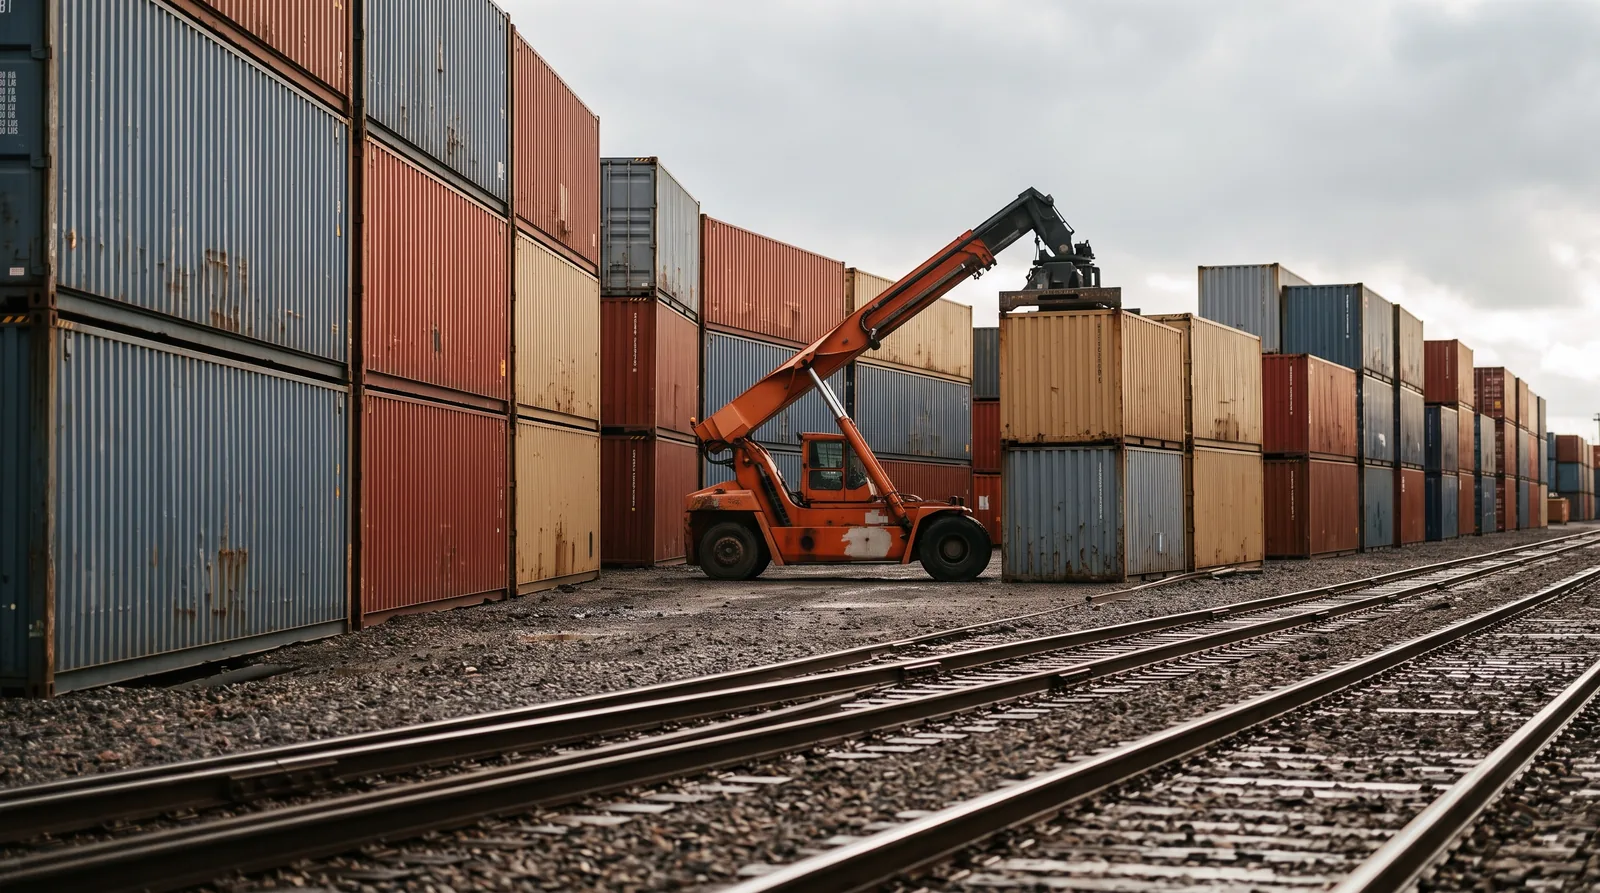
“Once you sign the contract you're going to be fixed with that supplier for three to five years.”
Resilience is buffer you paid for
That tolerance takes three forms and only three. You can hold it as inventory, as spare production or carrier capacity, or as time in the promise you make the customer.
The three are interchangeable in what they buy and very different in what they cost. Inventory consumes working capital, capacity consumes fixed overhead, and time consumes goodwill.
This page assumes you already know the field. For the definition, the boundary with logistics and the sector economics, read the pillar on how supply chains work. For the stages and where they hand off, read the supply chain process.
The measurement almost nobody reports
We downloaded the Fed's own monthly workbook in August 2026 and read every value in it, back to 1998. That matters because the number is routinely quoted second hand and the reporting month is often confused with the data month.
- GSCPI reading for July 2026, in standard deviations above the index average
- 0.80
- April 2026 reading, the highest since July 2022 and well outside a normal year
- 1.84
- Average of the twelve monthly readings in calendar 2025, an almost exactly ordinary year
- 0.00
Attention is moving the wrong way
We pulled live US search data for this topic in August 2026. Searches for supply chain resilience are down 45% year over year, supply chain risk management down 70%, and nearshoring down 47%.
One term rose. The bare definitional query is up 120%, which reads like new arrivals rather than active buyers.
Interest in this subject is countercyclical to the need for it. Pressure sat at roughly average through 2025 and attention held up. Pressure climbed through the first half of 2026 and attention fell.
Budgets follow attention. That is the practical reason resilience gets funded late, and it is a better explanation than any claim about executive short-termism.
Why a network amplifies a shock instead of absorbing it
The paper's original observation came from nappy orders at Procter and Gamble. Consumption was steady, retail orders were less steady, distributor orders less steady again, and factory orders swung hardest of all.
This is the reason resilience is a network property rather than a company property. A firm can be well run and still sit inside a chain that turns a 5% demand wobble into a 40% production swing three tiers up.
| Cause | What it looks like on the ground | The counter-move |
|---|---|---|
| Demand forecast updating | Each tier forecasts from the orders it receives rather than from real end demand, so every tier reads noise as signal. | Share point-of-sale or consumption data upstream, not order data. |
| Order batching | Buyers order weekly or monthly to save on freight and admin, so a smooth draw arrives upstream as spikes. | Shorten and stagger order cycles, or consolidate across products instead of across time. |
| Price fluctuation | Promotions and forward buying pull demand forward, then leave a hole behind it that looks like a collapse. | Flatten promotional pricing on inputs where the swing costs more than the discount saves. |
| Rationing and shortage gaming | When supply is allocated pro rata, buyers inflate orders to secure a share, then cancel once supply returns. | Allocate on past consumption rather than on current orders. |
Causes and their descriptions: Lee, Padmanabhan and Whang, MIT Sloan Management Review, 1997. The counter-move column is Insight Journal editorial judgment drawn from those causes, not a claim made by the paper.
Amplification gets worse as a business grows, because tiers multiply and the distance between the shelf and the factory lengthens. That is one of the risks of scaling faster than operations can carry.
Five structural moves, and what each one costs
Competing pages list moves like these and stop. The useful column is the next one: what each costs, and which line of the accounts absorbs it. No published source prices these universally, because the answer depends entirely on your inputs.
- 01
Map below tier one
Reduces the chance that the failure arrives from a supplier you cannot name.
Cost: Analyst time, and supplier goodwill you spend asking for information nobody owes you.
Lands on: Operating expense, headcount
- 02
Dual-source the choke points
Removes the single points whose absence stops output entirely.
Cost: Qualification spend per alternate supplier, plus the volume discount you give up by splitting the order.
Lands on: Gross margin, one-off project cost
- 03
Hold buffer where it is cheapest
Buys time to react, in whichever form is least expensive to carry.
Cost: Working capital if held as stock, idle overhead if held as capacity, service promise if held as time.
Lands on: Balance sheet, or fixed cost, or customer expectation
- 04
Shorten or regionalize the lane
Cuts transit time, which cuts the amount of buffer everything else needs.
Cost: Unit price, almost always. A shorter lane is rarely the cheaper lane.
Lands on: Cost of goods sold
- 05
Rehearse the failure
Converts an improvised scramble into a decision somebody already made calmly.
Cost: Roughly a day of senior time per critical node, repeated annually.
Lands on: Management time, no capital
- The one that is nearly free
Four of these five need budget. Rehearsing the failure needs a room and a morning, which is why it is the only one a twelve-person company should start with.
Buffer held as stock is the move with the clearest financial signature, because it moves cash out of the business and parks it. Read it alongside how cash flow is actually managed rather than as a standalone operations decision.
How to tell whether resilience actually improved
Where the pair came from
The model was developed by David Simchi-Levi and colleagues at MIT and applied at Ford from 2013. Google's own answer panel now repeats both terms without naming anyone, which is how a real framework quietly becomes folklore.
Its most useful finding is counterintuitive. Ford's largest exposure sat with small suppliers of inexpensive components, not with the strategic suppliers a spend-ranked review reaches first.
Do not invent a metric SCOR already has
ASCM's SCOR Digital Standard already carries Agility as a performance attribute, with Supply Chain Agility as its Level-1 metric, and Cash-to-Cash Cycle Time under Assets. Those are the right two for the volume absorbed and the cash consumed.
Their codes, attributes and definitions sit in the SCOR Level-1 metrics and the codes behind them, so they are not repeated here.
Read the two together and the overbuying signal is obvious. When cash-to-cash cycle time lengthens while on-time delivery has stopped improving, the last increment of buffer bought nothing.
Which standard actually applies
Two published standards are relevant and neither appeared on any page in the live US top ten for this term. Both describe what a defensible process looks like. Neither tells you how much buffer to hold.
Business continuity, organisation wide
Its full title is Security and resilience: Business continuity management systems, Requirements. It is certifiable, and its scope is the whole organisation rather than the supplier network specifically.
Useful when a customer or an insurer asks for evidence that disruption planning exists.
Cyber supply chain risk, US federal baseline
Published May 2022 and driven in part by Executive Order 14028, it sets out cybersecurity supply chain risk management practices for systems and organisations. The full text is free.
If you sell to a federal agency this is not optional reading. If you do not, it is still the most detailed public account of supplier risk assessment available at no cost.
Which move to buy first
Step one
Write the list
Name every input whose absence stops output inside a week, and the supplier behind it. Most companies under fifty people can do this on one page in an afternoon, and most have never done it.
Output: A ranked list of critical nodes
Step two
Time the worst node
For the top three, estimate Time-to-Recover from the supplier and Time-to-Survive from your own stock and alternatives. The gap between them is the only number worth taking to a budget conversation.
Output: A gap, in days
Step three
Buy the cheapest closure
Close that one gap with whichever form of buffer costs least to carry, then re-time it. Buying a second supplier when four weeks of stock would have done is the most common overspend in this field.
Output: One gap closed, then repeat
The framework has an obvious failure mode, so we will name it. It assumes you can identify your critical nodes, and the MIT work suggests the dangerous ones are frequently too cheap to attract attention.
Deciding who owns that list across purchasing, production and planning is not a supply chain question at all. It is operations management, and it usually has no owner until someone appoints one.
How we researched this page
Every index value here came out of the Federal Reserve Bank of New York's published GSCPI workbook, which we downloaded and parsed in August 2026. We did not take a reading from a news summary, and we checked the April 2026 peak against the full series ourselves rather than repeating the claim.
The bullwhip causes are quoted from the 1997 MIT Sloan Management Review paper that named them. The counter-move column beside them is our own reasoning and is labelled that way on the table.
One disclosure matters here. Six of the nine pages ranking for this term in the live US results sell software, ratings, research or memberships into the category they are describing. We sell none of those, and we have said so rather than quietly citing them as neutral.
This page carries a house byline and claims no operator case studies, a rule set out in our editorial and research policy.
- No dated, retrievable primary figure for average US inventory carrying cost as a share of inventory value, so no carrying-cost percentage is printed here.
- The four pillars framing repeated across the first page has no traceable owner. We could not find one, so we did not present it as canonical.
- The Time-to-Recover and Time-to-Survive material was confirmed through MIT's own reporting rather than the underlying journal article, so no numeric result is quoted from it.
- US logistics cost totals are reported inconsistently between sources this session, so that figure stays on the pillar page and is not restated here.
- Vendor pages carrying yearless percentages were excluded rather than repeated.
Supply chain resilience: common questions
What is supply chain resilience?
What are the four pillars of supply chain resilience?
What are the 7 C’s of resilience theory?
How do you measure supply chain resilience?
Is supply chain pressure actually rising right now?
How much does supply chain resilience cost?
Which standard covers supply chain risk: ISO 22301 or NIST?
Which supplier should I dual-source first?
Does any of this apply to a company with twelve people?
How do I justify resilience spending in a calm year?
Sources
Reviewed 18 August 2026- 1. Global Supply Chain Pressure Index (GSCPI), monthly data workbook , Federal Reserve Bank of New York, 2026
- 2. The Bullwhip Effect in Supply Chains (Lee, Padmanabhan and Whang) , MIT Sloan Management Review, 1997
- 3. Companies use MIT research to identify and respond to supply chain risks , MIT News, 2022
- 4. ISO 22301:2019, Security and resilience: Business continuity management systems, Requirements , International Organization for Standardization, 2019
- 5. SP 800-161 Rev. 1, Cybersecurity Supply Chain Risk Management Practices for Systems and Organizations , NIST (US National Institute of Standards and Technology), 2022
- 6. SCOR Digital Standard overview , ASCM (Association for Supply Chain Management), 2025
- 7. The Seven C’s: The Essential Building Blocks of Resilience (the origin of the phrase, in paediatrics rather than operations) , Kenneth R. Ginsburg, MD